This content is also available in video format in this playlist.
Contents
Introduction #
Now that we have presented the basic concepts in Part 1, we can move on to the core concepts that underpin chain analysis by expanding our analyses to include “external” transaction data.
Specifically, Part II will focus on two of the most important tools underpinning chain analysis:
- The transaction graph
- The common input ownership heuristic (aka wallet clustering)
External Transaction Data #
External transaction data can be used to improve confidence in change detection (weaken transaction privacy) by leveraging additional information and patterns.
External transaction data includes any information not strictly limited to the information included in an individual transaction by the bitcoin protocol. Examples include:
- address reuse over multiple transactions
- co-spending from multiple addresses in the same transaction (wallet clustering)
- multi-sig scripts (which are only revealed after a UTXO is spent)
- wallet fingerprinting over a series of transactions
- off-chain data such as outputs spent to labelled clusters and IP addresses of nodes broadcasting a transaction
- volume, timing, and other transaction pattern recognition analysis
Transaction Graph Analysis #
Transaction graphs are the simplest way to show the relationship of inputs and outputs across multiple transactions.
OXT’s transaction graph is a Directed Acyclic Graph (DAG). DAG graphs are used to map the relationship between two different objects. In the case of bitcoin, the transaction graph maps the relationship between UTXOs and transactions.
OXT Transaction Graph Basics #
The transaction graph is best understood through interaction, but before we get started we will introduce some of the functionality of the OXT transaction graph.
- To access the transaction graph, navigate to the TRANSACTION tab on OXT by imputing or clicking a TxID of interest.
- Click the TX GRAPH ICON icon on the tool bar on the left side of the screen.
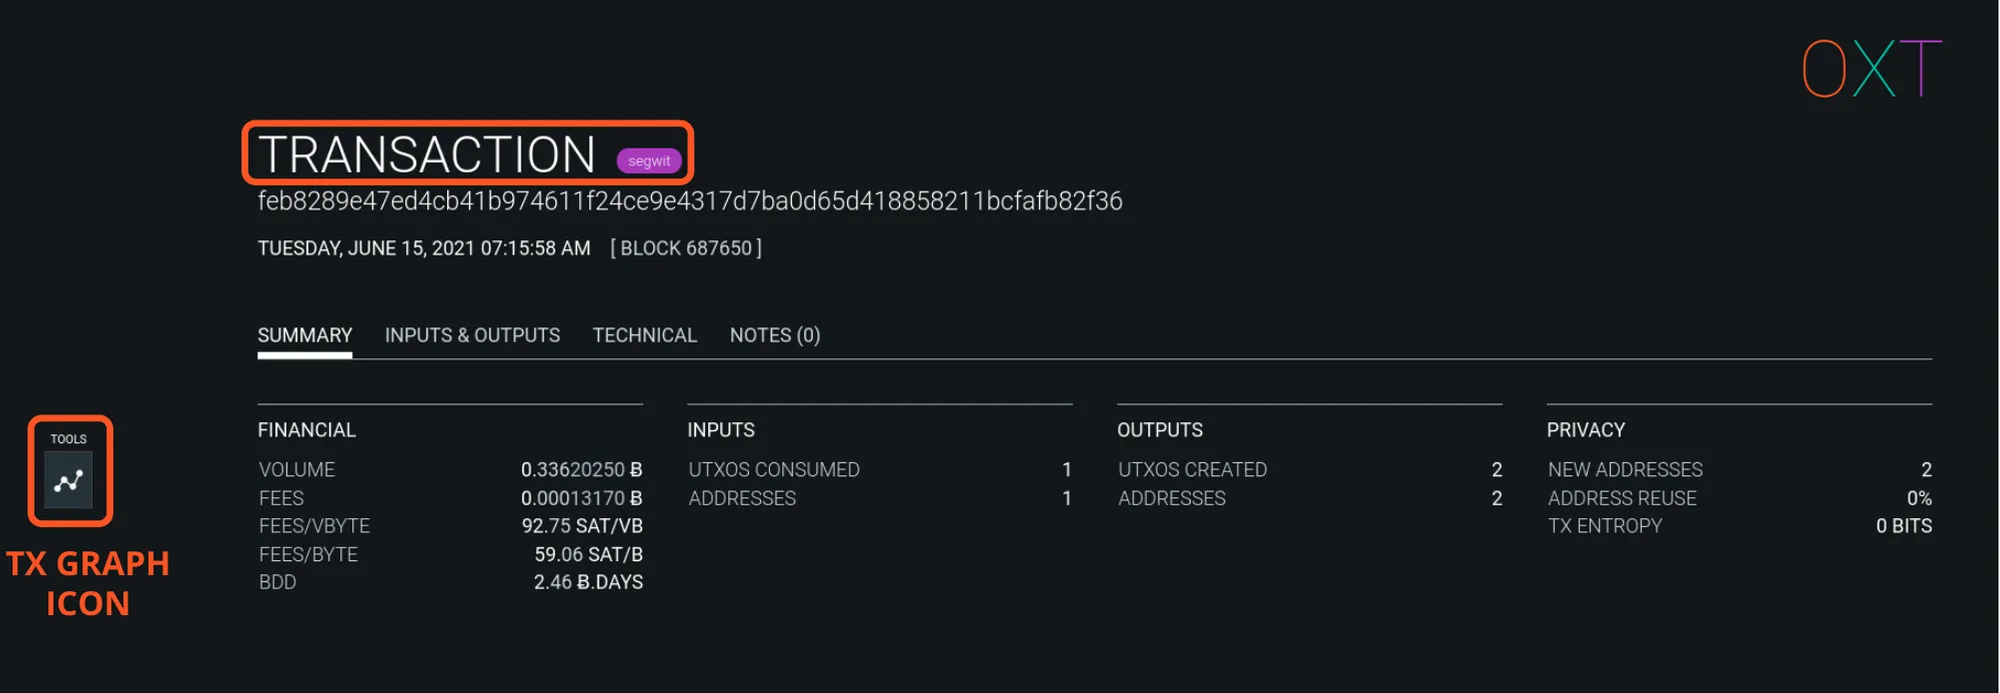
OXT Transaction Page and Navigation to TxGraph
The starting transaction will be displayed. Transactions are presented as vertices (circles) on the graph. Vertices represent a change in the UTXO Set by showing a new relationship between UTXOs consumed and created by a transaction.
Single clicking the transaction will select the transaction, change its colour from blue to green, and display additional options on the toolbar (left side of screen).
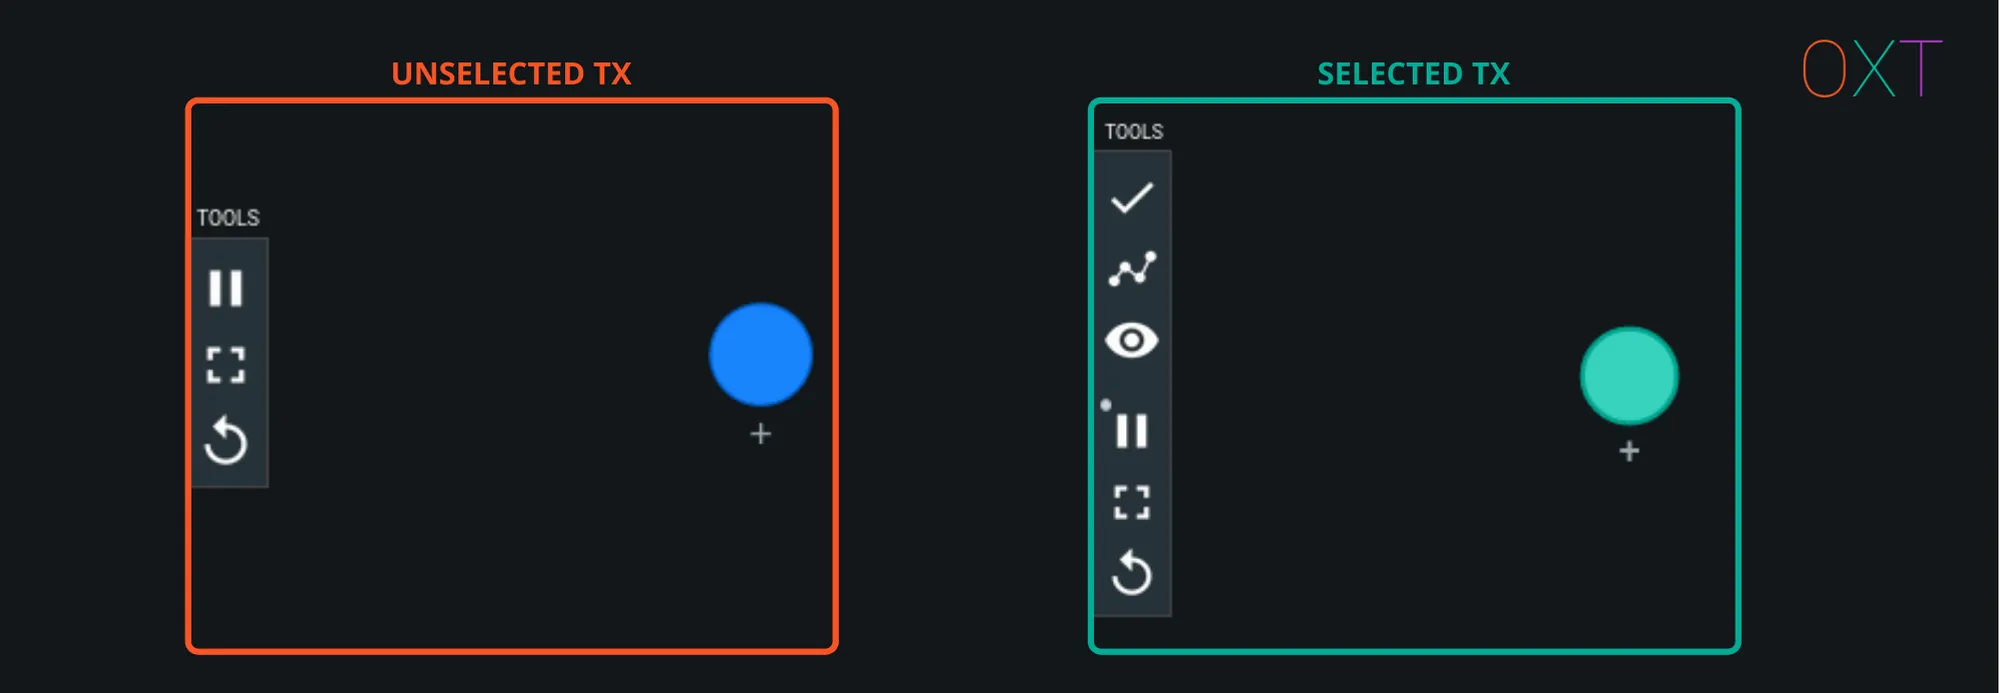
Initial TxGraph with Select and Toolbar
The tool bar icons perform the following actions:
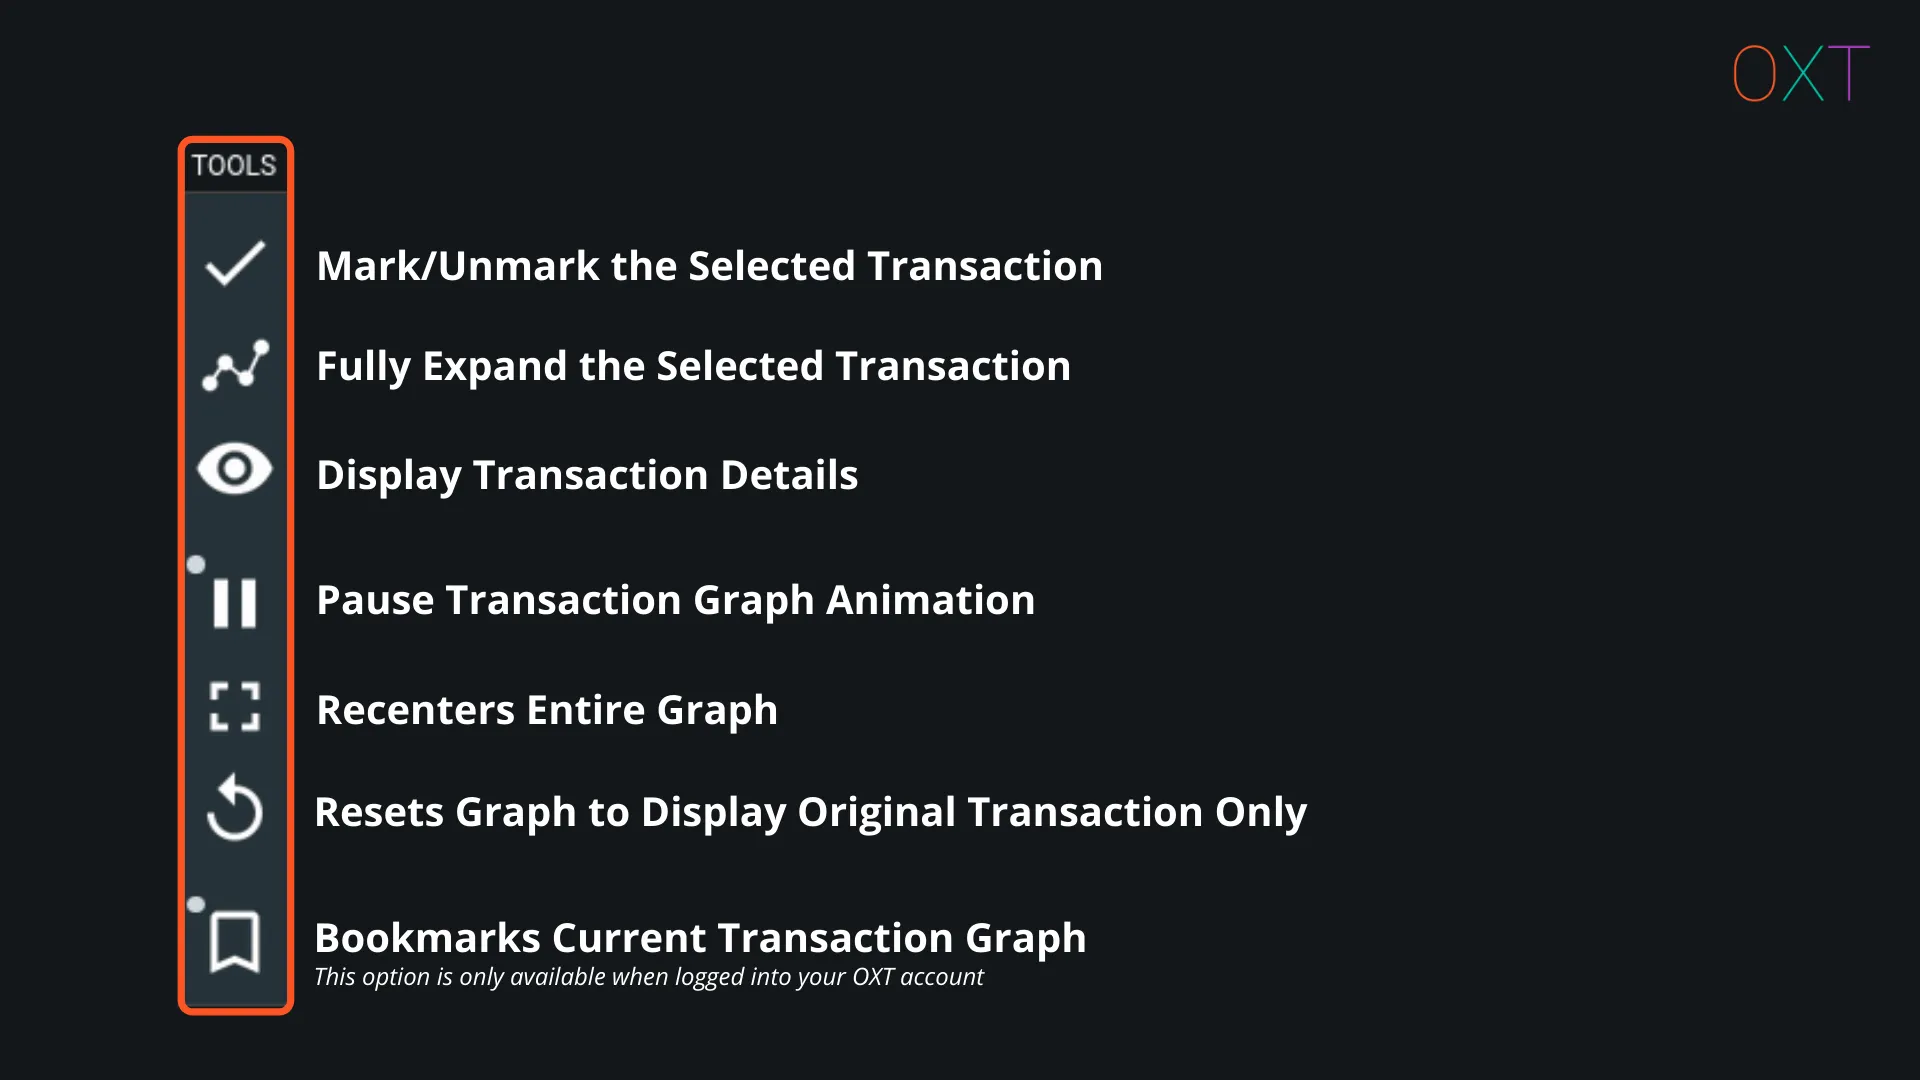
TxGraph Toolbar Actions
Double click the transaction to fully expand all transaction UTXOs. The UTXOs are displayed as “edges” (lines) with arrows indicating if the UTXO is an input (pointing toward the transaction) or output (pointing away from the transaction). The graph will also display the transaction creating the inputs or consuming the outputs. If the output is unspent, an unfilled diamond will be displayed on the end of the UTXO.
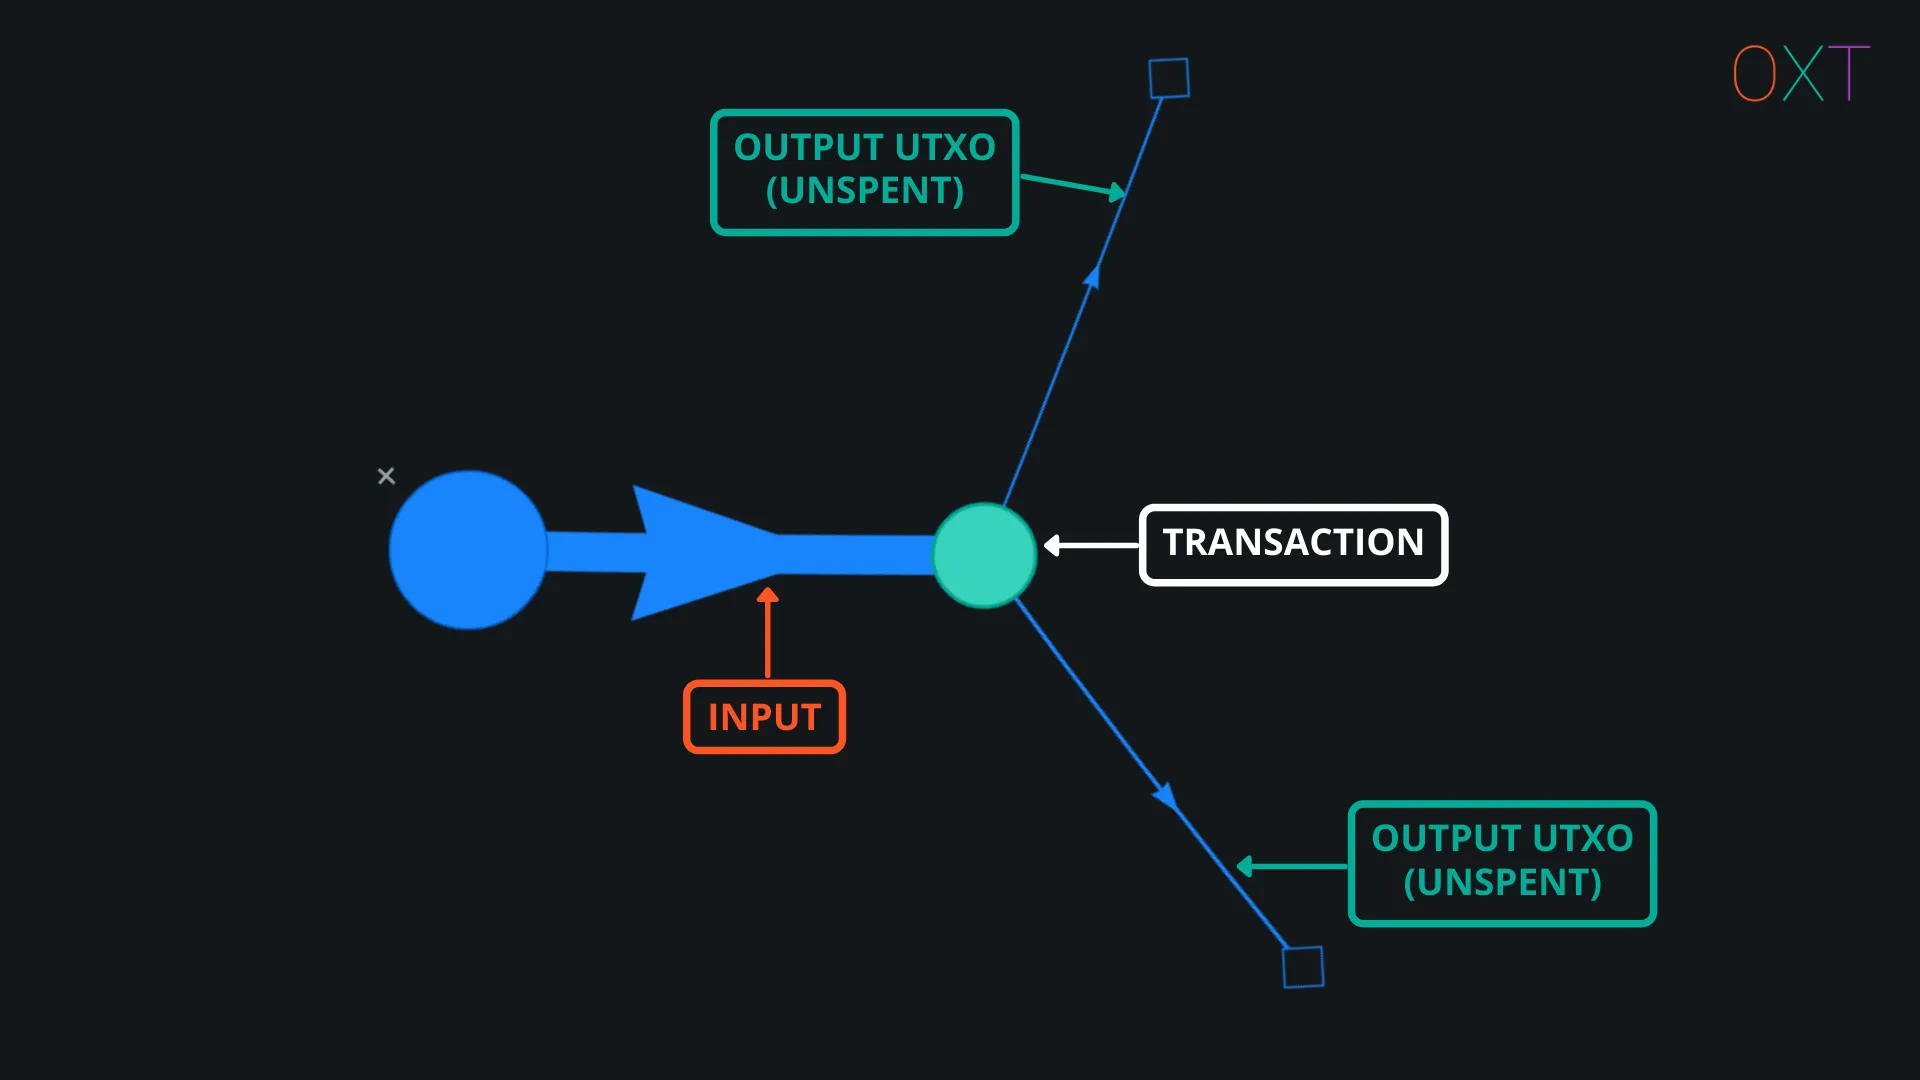
Fully Expanded Transaction
Double-clicking or fully expanding a transaction can make your transaction graph noisy and difficult to read. To minimise clutter, we suggest selectively expanding UTXOs. To selectively expand UTXOs, select the transaction and open the Transaction Details window. The transaction inputs and outputs can be selectively expanded by hovering the mouse to the right of the address text and selecting the visible Expand Tx Graph.
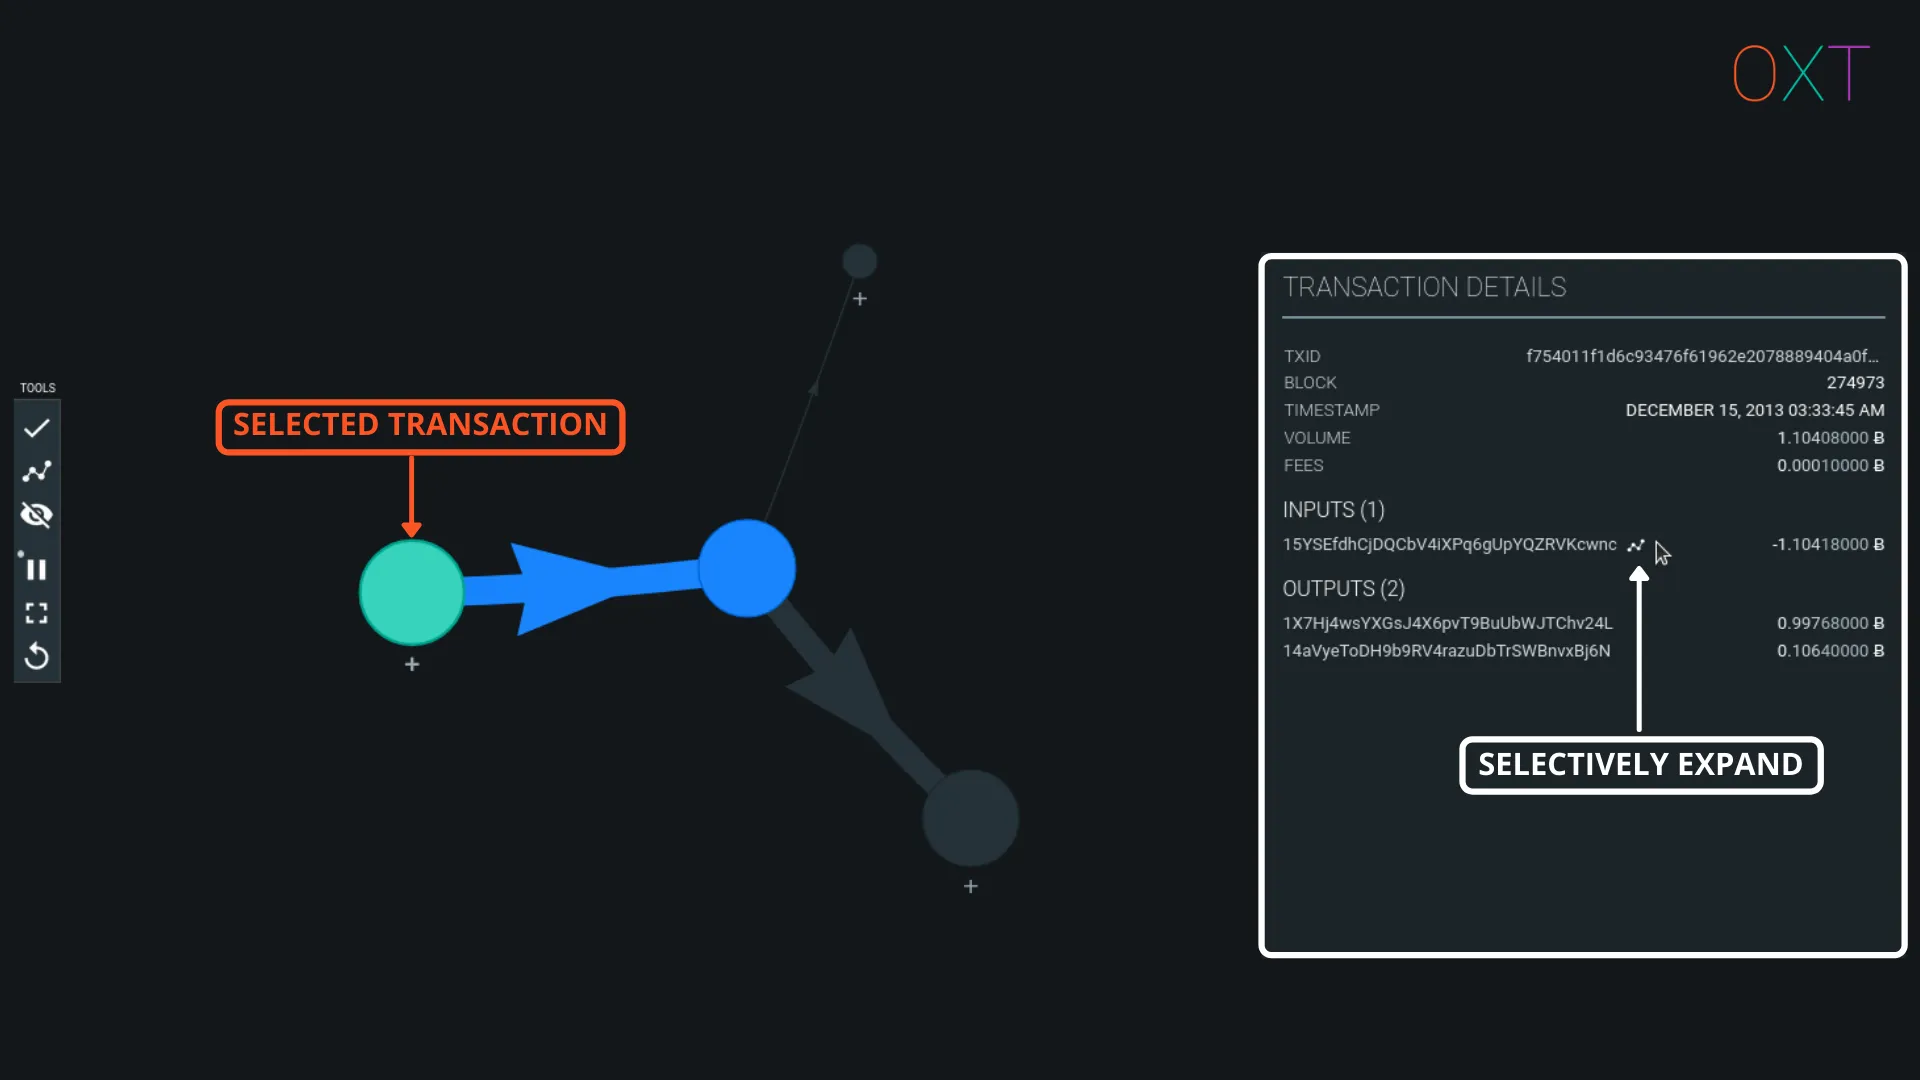
Selective UTXO Expansion
On the graph, hovering the mouse over an input or output will display additional information about the object of interest, without the need for expanding the transaction details tab.
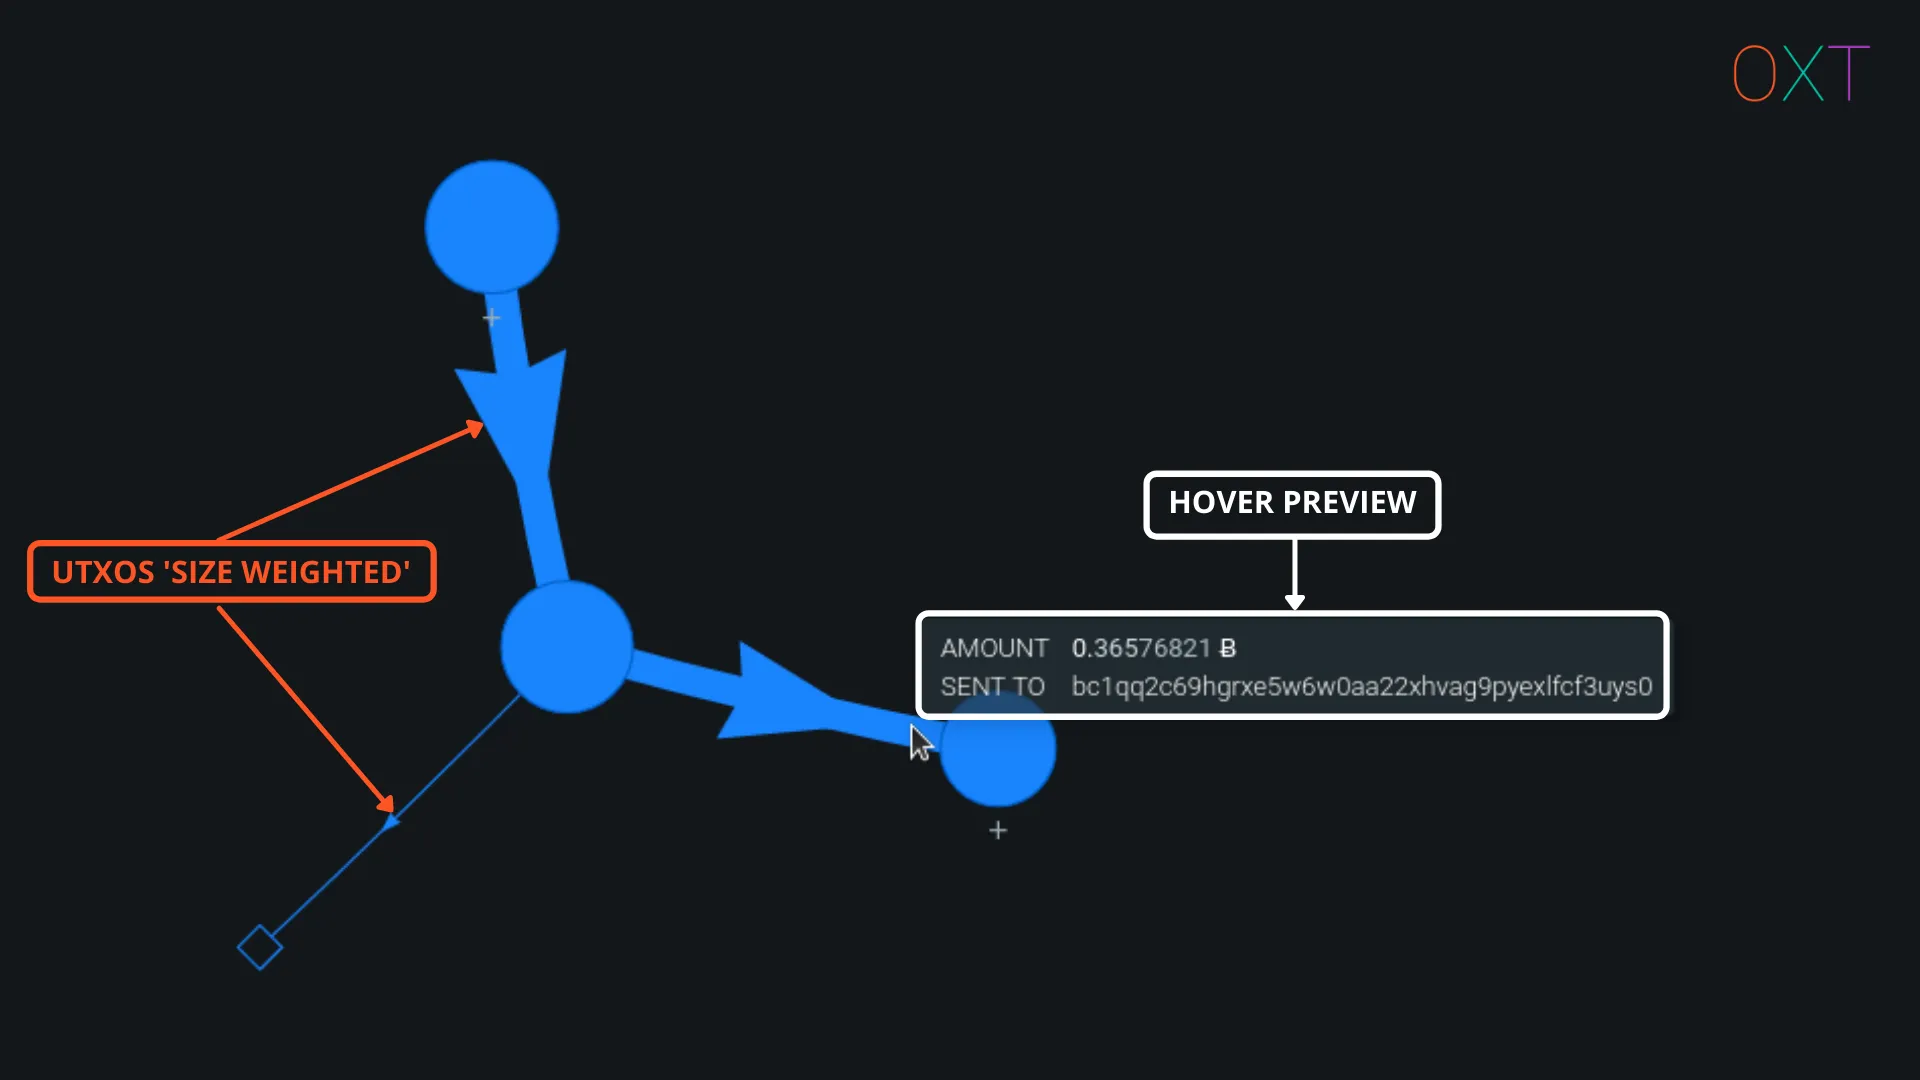
Tx Graph Line Weight and Preview
OXT’s transaction graph will also help to process some additional information automatically. Transactions and UTXOs will be “weighted” on a relative basis based on their BTC volumes. This can be very helpful for change detection and illustration of “peel chains”, which we will discuss in further detail below.
OXT Peel Chain Transaction Graph Example #
A simple transaction graph example is presented below.
Navigate to the hyperlink of the transaction page and expand the transaction graph.
Select the transaction with a single click.
Open the transaction details window by clicking the respective icon on the left toolbar.
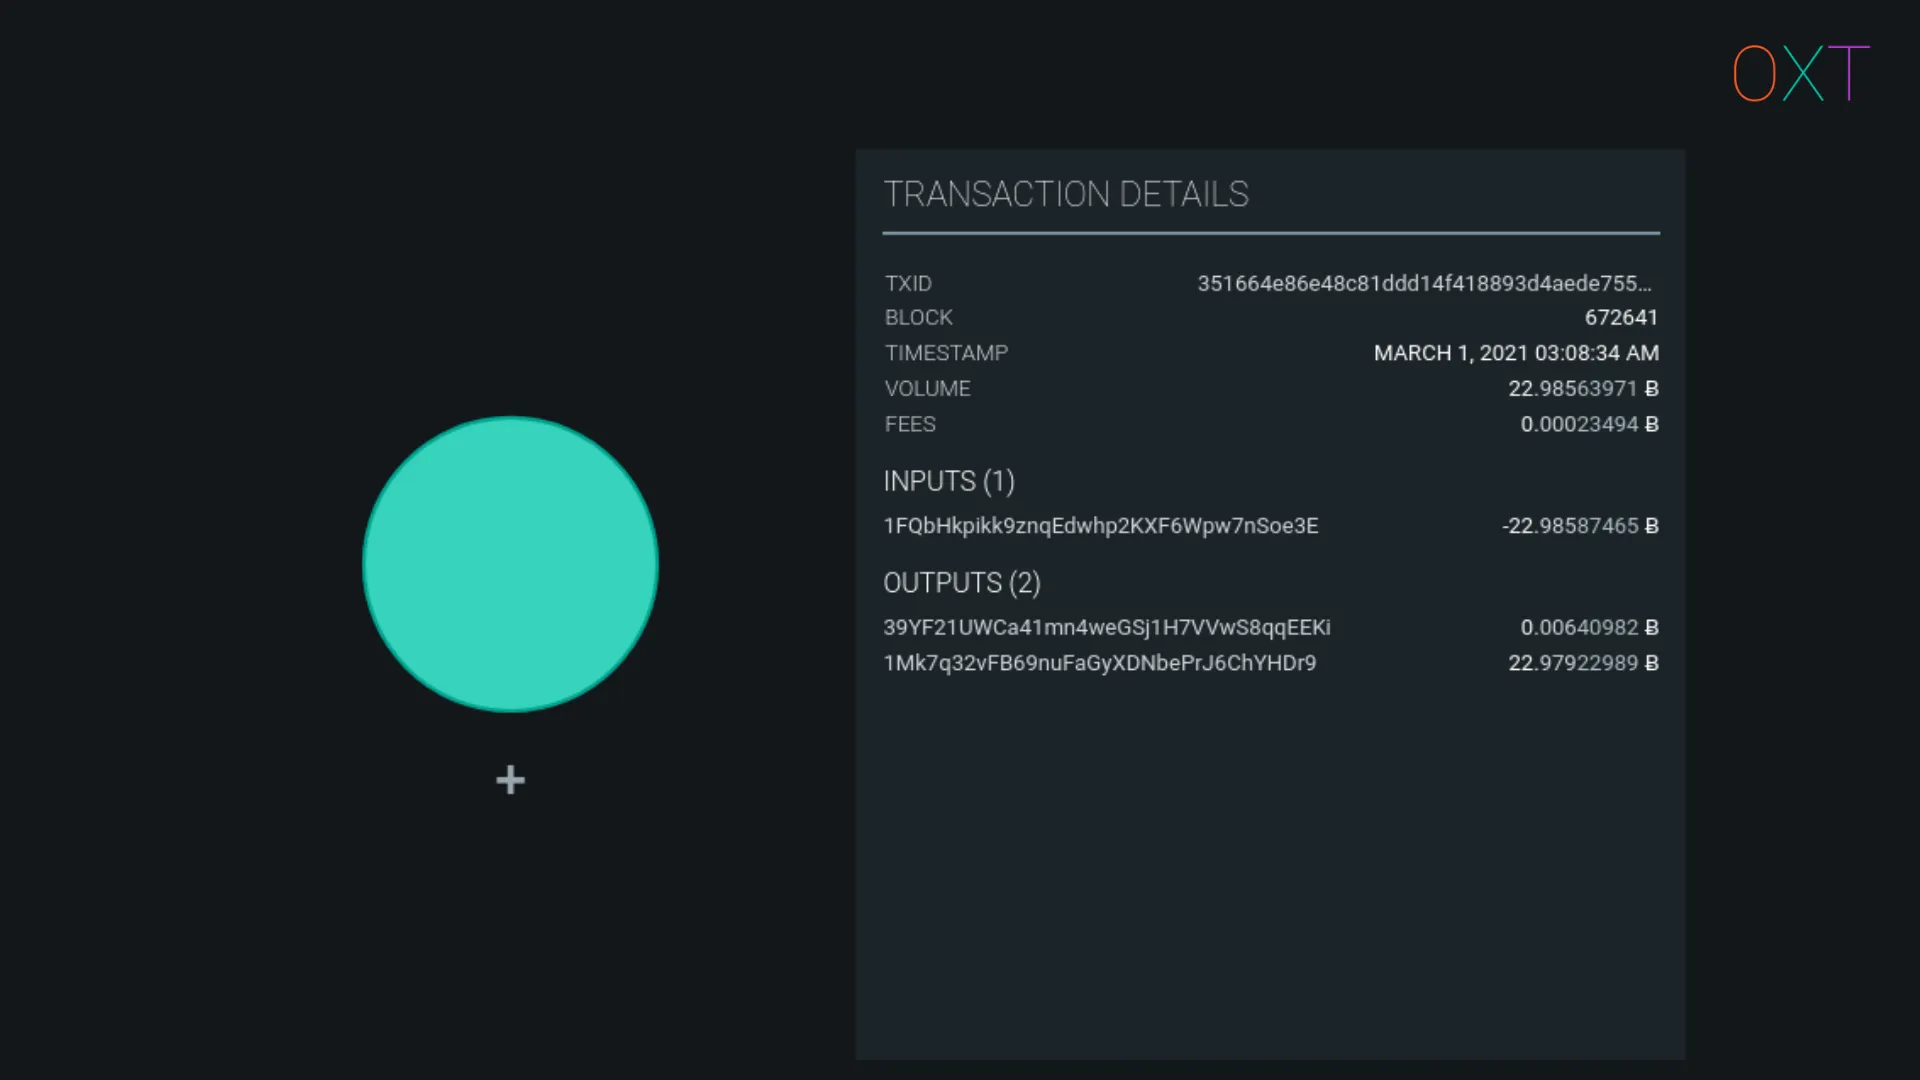
Selected Transaction and Transaction Details
Double click the starting transaction to expand all inputs and outputs.
Zoom out using the mouse scroll wheel and re-orient the graph with the oldest transactions in your preferred order (ie. left to right) by clicking and dragging the transactions in the preferred orientation.
The two outputs present us with a question to answer if we are going to attempt to track the activity of the wallet creating the transaction.
Which output do we follow?
If we apply the different script heuristic (see Part I), we identify the second output as change.
Double click the next transaction that spends the second output from the original transaction.
Repeat the process for change identification using the heuristics presented in Part I. Expand two more transactions using this process.
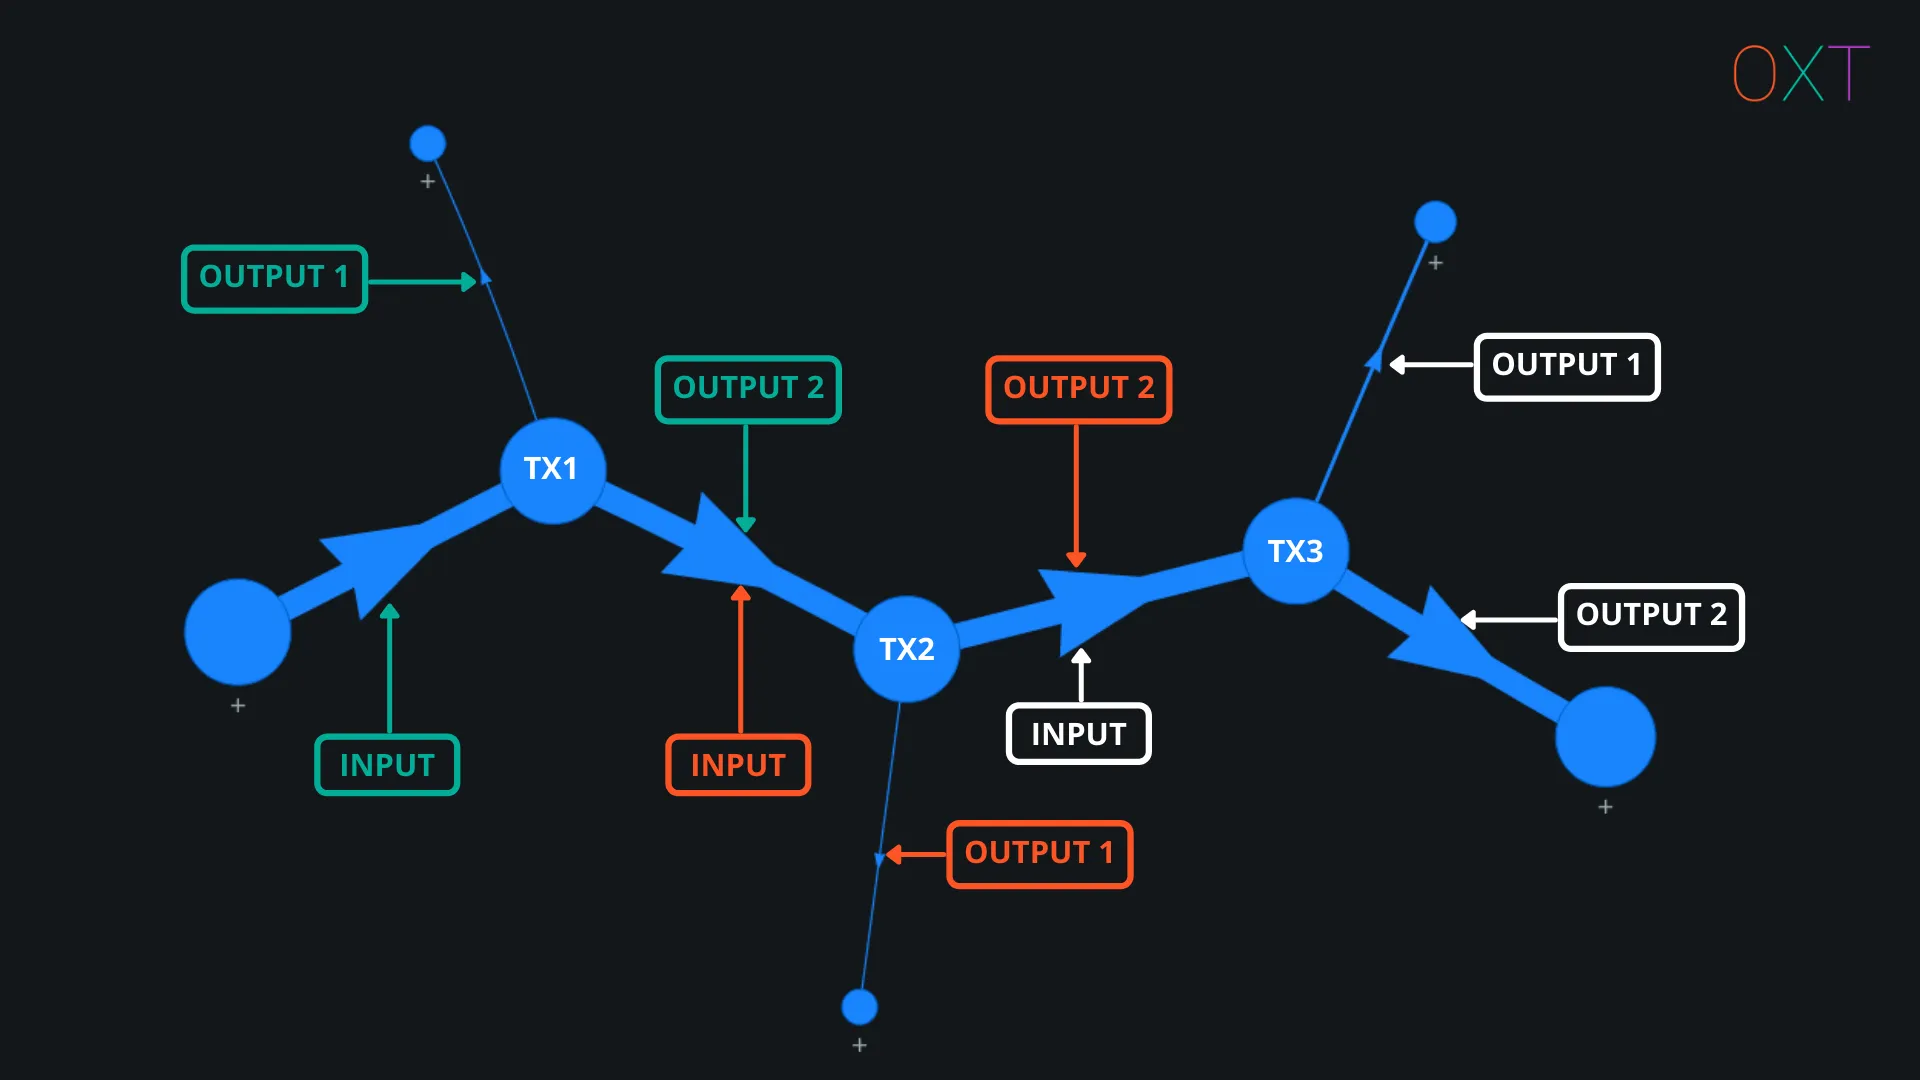
Peel Chain Example (Tx Graph Bookmark)
Afterwards, the graph should look similar to the image in Fig 2.8 above. To add additional emphasis on the change UTXOs, the change UTXOs can be marked and highlighted in orange using the left toolbar button. A transaction graph showing a series of simple spends from the same wallet is commonly referred to as a “peel chain”.
Chain surveillance firms attempt to frame peel chains as a form of suspicious activity related to “structuring or money laundering.” Though as we described in part 1, approximately 50% of bitcoin transactions are simple spends with 1 input and 2 outputs, in other words entirely normal behaviour.
For our purposes, a peel chain is the simple process of tracking a single wallet’s activity over multiple transactions.
Wallet Fingerprinting and Transaction Graph Interpretation #
As you continue interacting with the example peel chain, additional patterns indicative of a consistent wallet fingerprint will become apparent. Including the following:
- The largest output, shown by OXT’s automatic line weight feature makes the change outputs readily apparent.
- The change outputs are always paid to P2PKH addresses.
- The change outputs are always the second of the two outputs.
- Not shown on the graph, but also worth noting are the consistent transaction version number (2) and lock-time (0) throughout the graph. To see this information, click the transaction ID in the transaction detail window to navigate to the TRANSACTION page. Then select the the TECHNICAL tab to display the transaction version number and lock-time.
- Expanding the previous or future spending history of this transaction graph will reveal more transactions with the same pattern.
Each of these patterns can be used to describe the behaviour of the observed wallet software. Generalisation of observed wallet behaviour is referred to as wallet fingerprinting, which leverages the following patterns:
- Input and output address scripts
- Change UTXO position consistency
- Version number and lock-time
Combining the above patterns can give an analyst high confidence in their interpretation of change outputs. We confirmed these change interpretations by interacting with the service responsible for this transaction activity. The example peel chain shows activity from a well-known custodial tumbler payout mechanism. Explore the graph source by backtracking from the provided transaction to find coins related to an exchange hack.
In the next section, we will discuss how transaction graph analysis can be improved further by using wallet clustering and monitoring outputs for spends to centralised services.
Wallet Clustering — Common Input Ownership Heuristic #
The remaining critical chain analysis tool is referred to as “wallet clustering”. Clustering aggregates addresses based on their co-spending patterns and assumptions about normal wallet software behaviour.
Most bitcoin wallets today are hierarchical deterministic wallets. They generate a single master private key which is used to derive child private/public keys and the associated addresses.
Wallet software typically creates a new address automatically for each received payment (UTXO received). If a single UTXO or address balance is not adequate for making a payment, a wallet will include additional UTXOs/addresses controlled by different private keys/addresses as necessary to spend the desired amount. Most wallets do this automatically without user input.
Because of this normal wallet functionality and bitcoin’s private/public key cryptography backing, an analyst can assume that each address used as an input to a transaction, is controlled by the same private key or wallet software.
The assumption that each input to a transaction is controlled by the same wallet is called the common input ownership heuristic (CIOH) or more simply, the merged input heuristic.
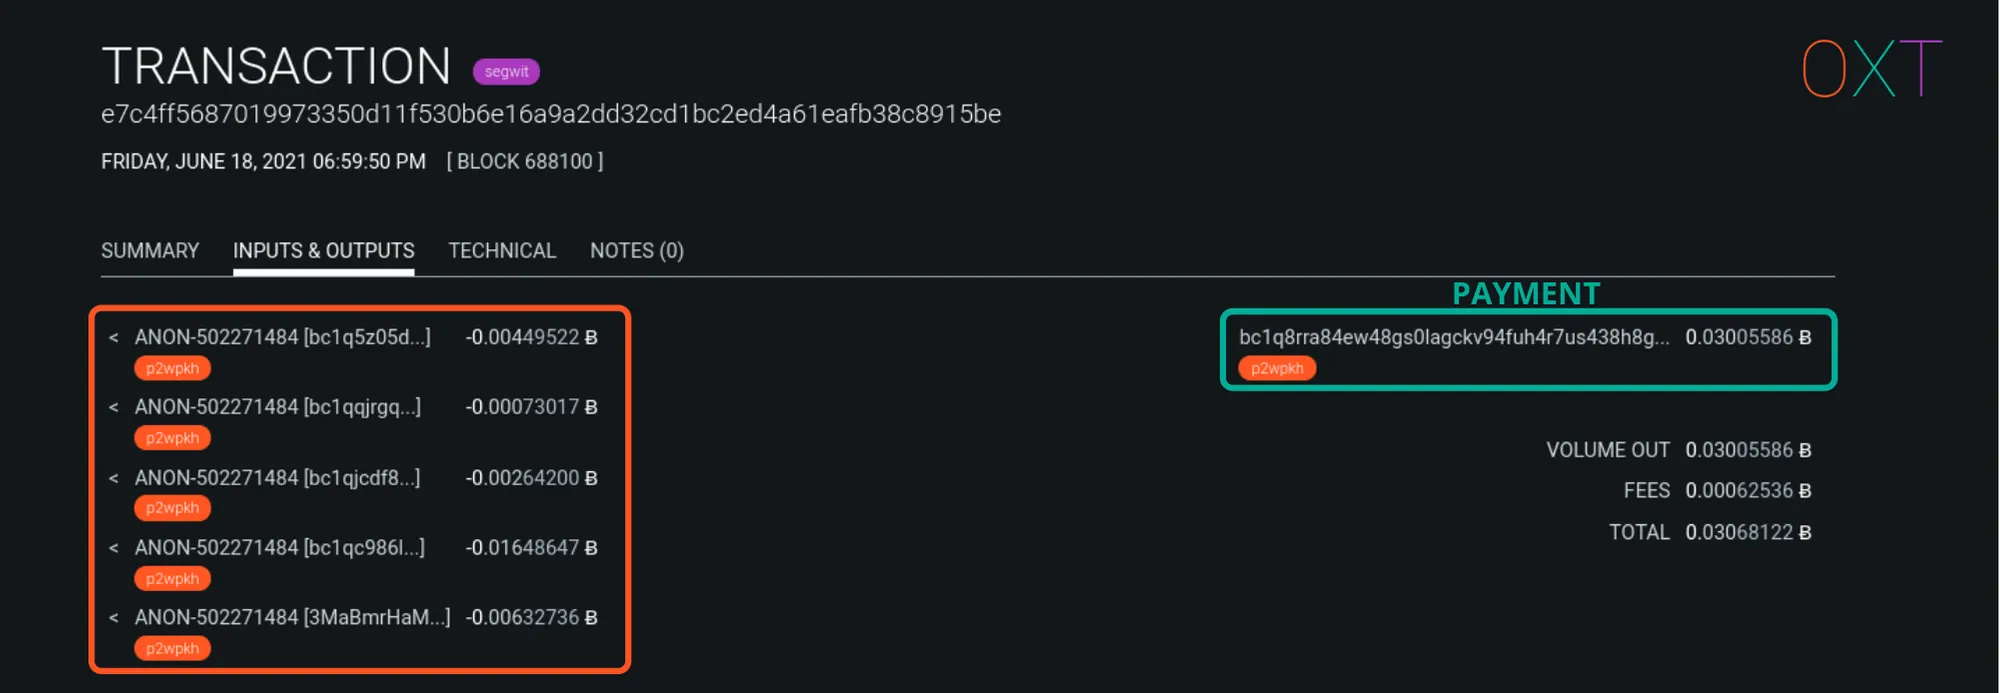
CIOH and Cluster Example
Like all heuristics there are specific scenarios where the CIOH does not hold true. The breakdowns in the CIOH tend to revolve around specially constructed privacy enhancing transactions. We will cover the special scenarios where the CIOH is broken and how OXT handles these exceptions in a later part of this series.
The ANONs — OXT’s Clustering Scheme #
Separate addresses that are assumed controlled by the same wallet are usually given a wallet cluster ID by analysis software. Due to bitcoin’s pseudonymous nature a wallet cluster may be representative of a single user or centralized service’s activity.
But without additional information, the wallet remains “anonymous” in that it has not been attributed to any real world entity activity. As a result, OXT gives each new cluster an ANON prefix followed by an index number.
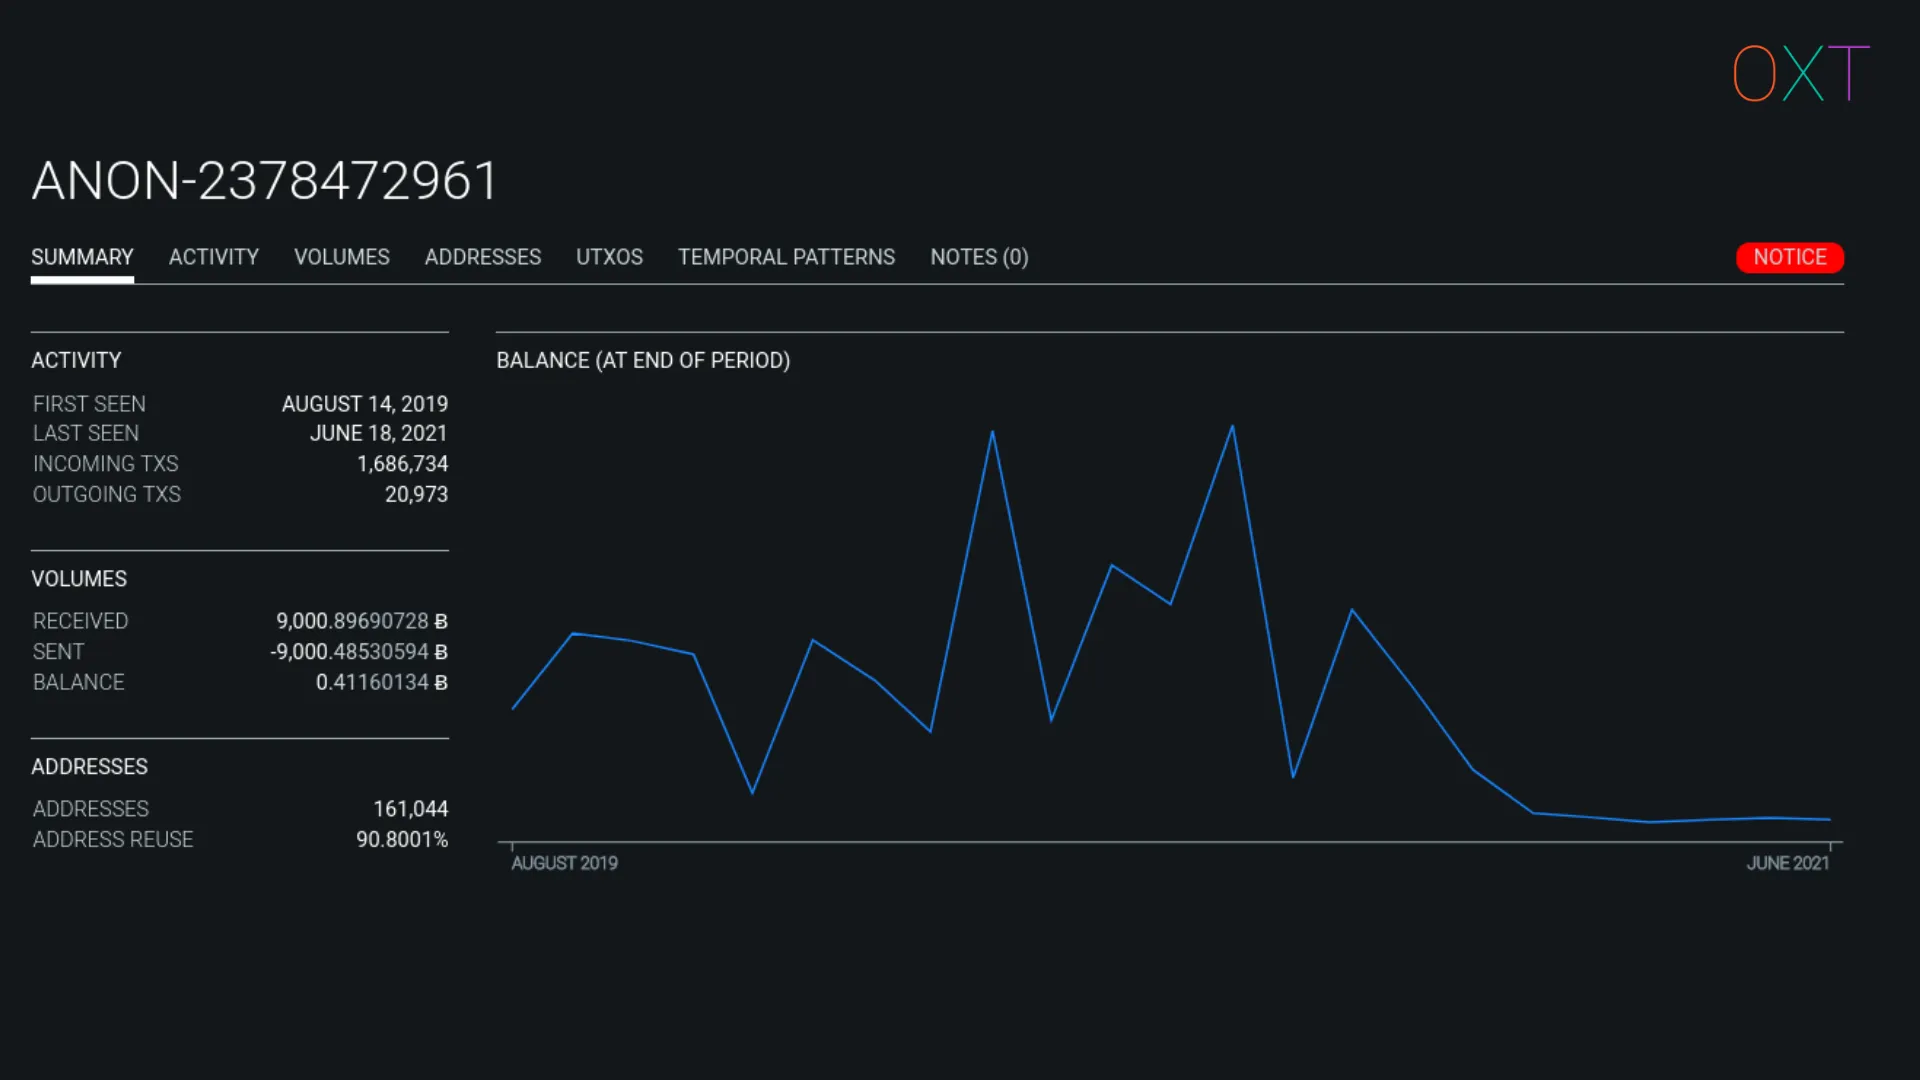
ANON Wallet Cluster Example
OXT calculates several cluster types of cluster activity including:
- A summary of general activity (balance, number of transactions, active dates, number of addresses)
- Plots of monthly and daily transaction activity, BTC volumes sent and received, UTXOs sent and received, and address stats
- A temporal pattern of cluster activity by day of the week and hours
- A notes section where OXT users can add notes on possible attribution or context for interacting with an unknown cluster during an investigation.
OXT’s general cluster stats are viewable without an account. However, with a free OXT account (no email required), a user can access additional features. When logged in, cluster statistics including daily balance, daily volumes, transaction lists, address lists, and more are accessible.
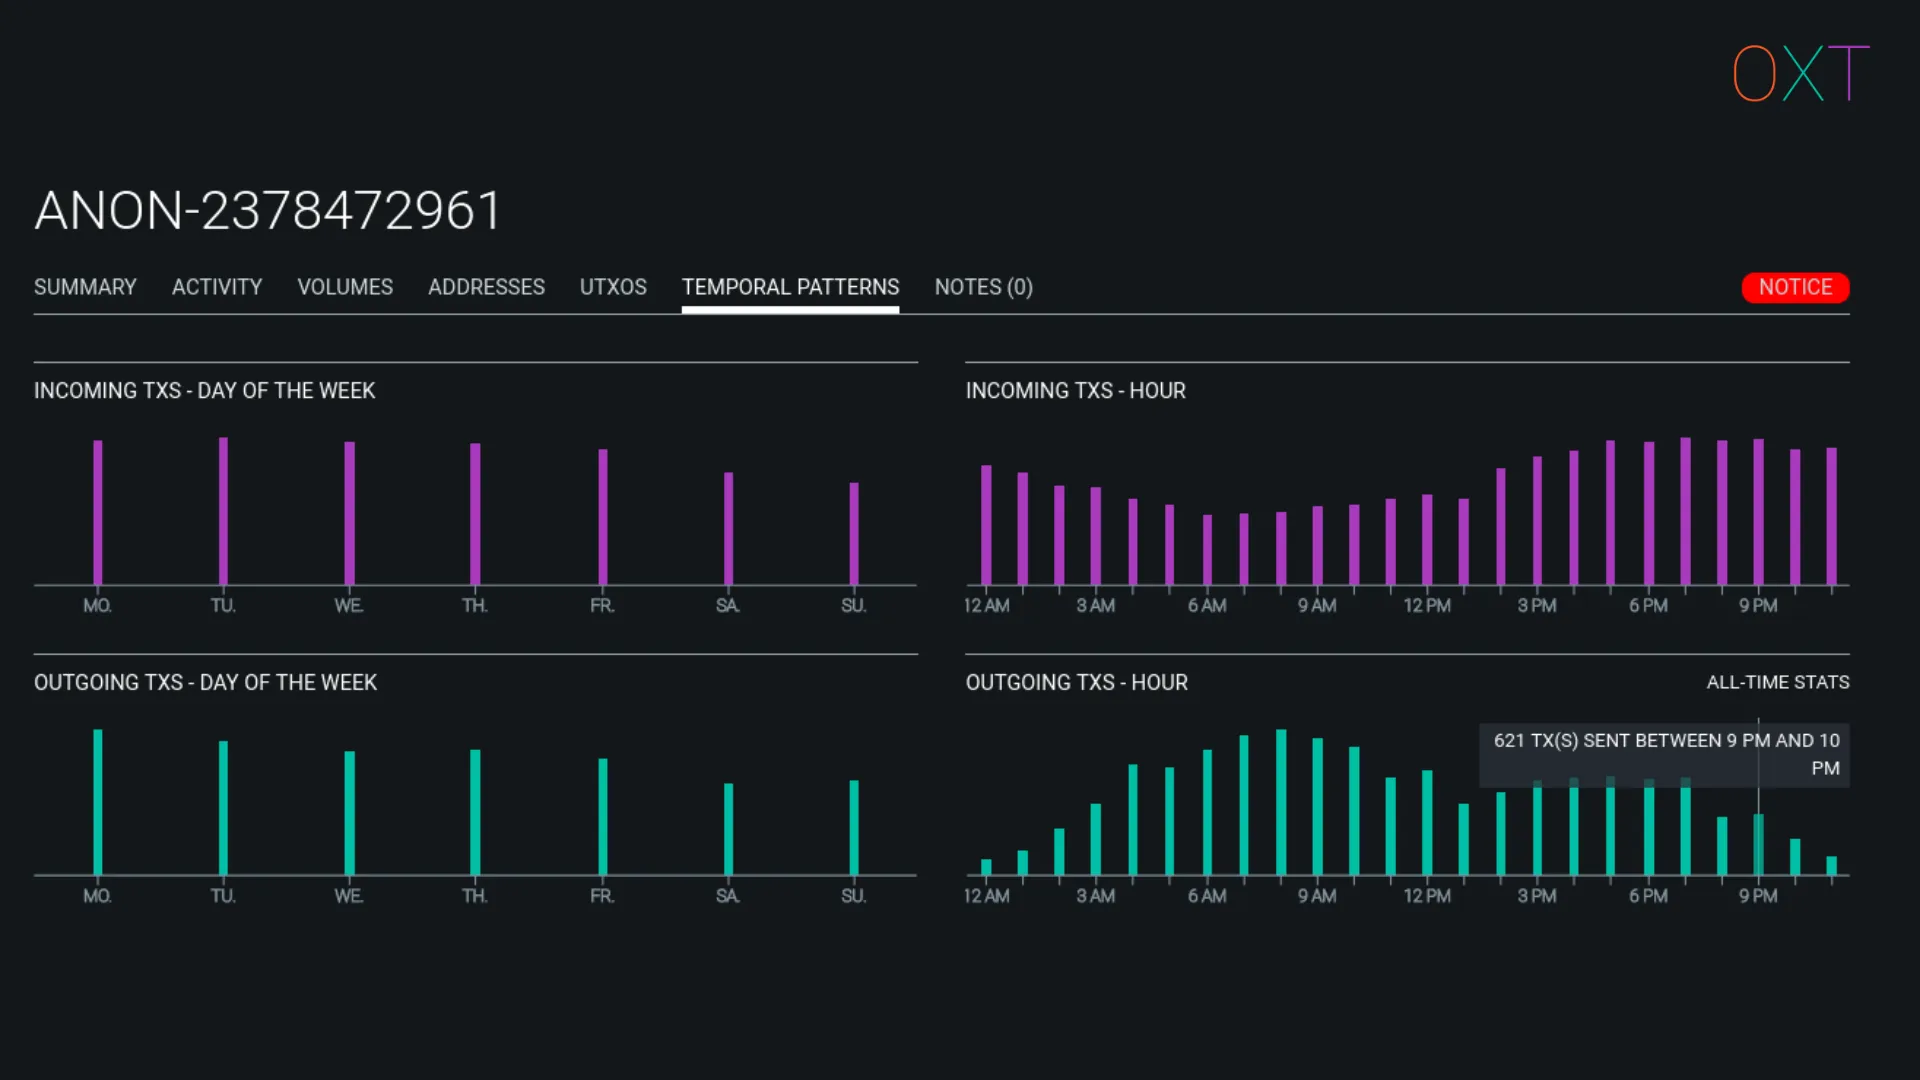
ANON Wallet Cluster Temporal Patterns
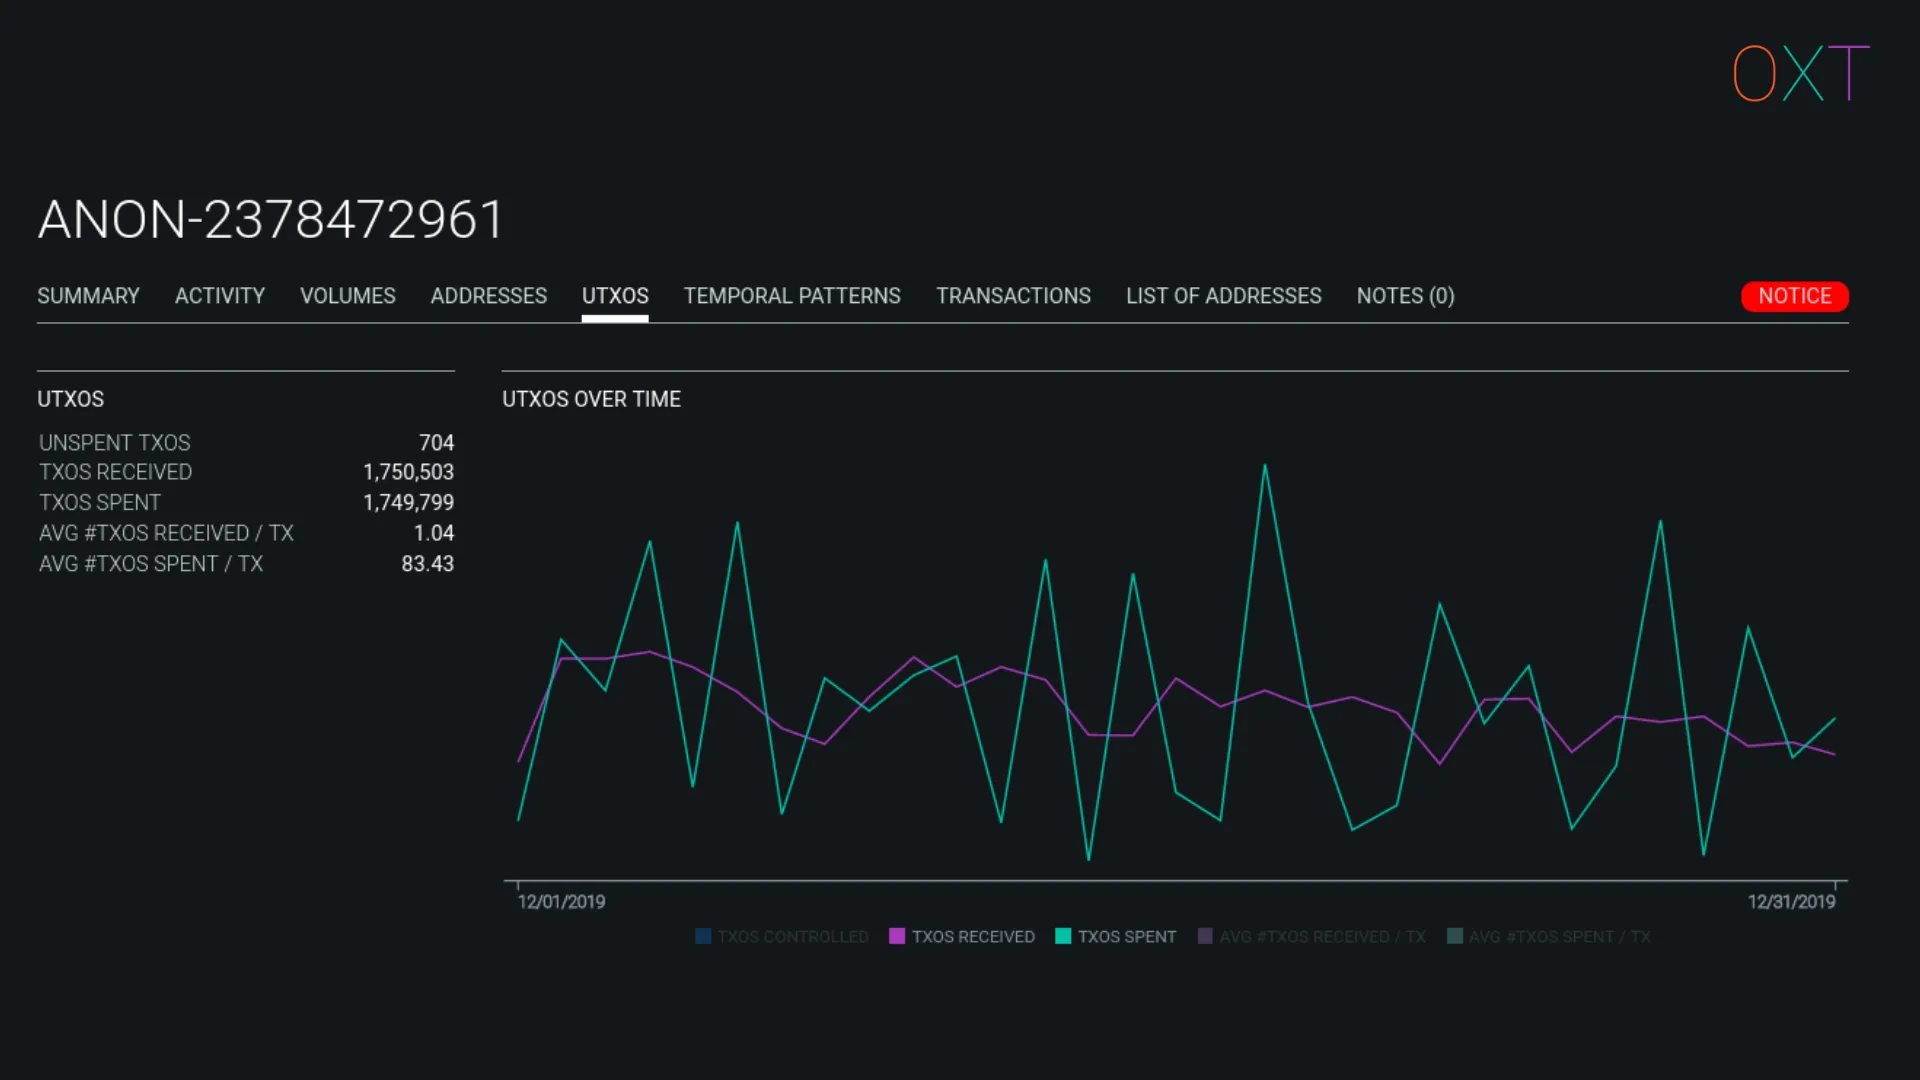
ANON Wallet Cluster UTXO Activity Tab
Cluster Attribution — ANON to Labeled Service #
Using the CIOH, OXT will keep track of a wallet cluster’s on-chain activity. To attribute the wallet cluster to a specific service requires interacting with the service.
An analyst can create an account with a service and send BTC to a deposit address provided by the service. From there, the analyst can monitor the spending of their deposit UTXO. When spent the analyst can attribute the address and its co-spent addresses to the corresponding cluster ID.
Alternatively, an analyst can use opensource intelligence techniques to search for publicly available information posted by service users. Deposit and withdrawal addresses can be commonly found in social media posts. This publicly available data can also be used to attribute a wallet cluster to a centralised service.
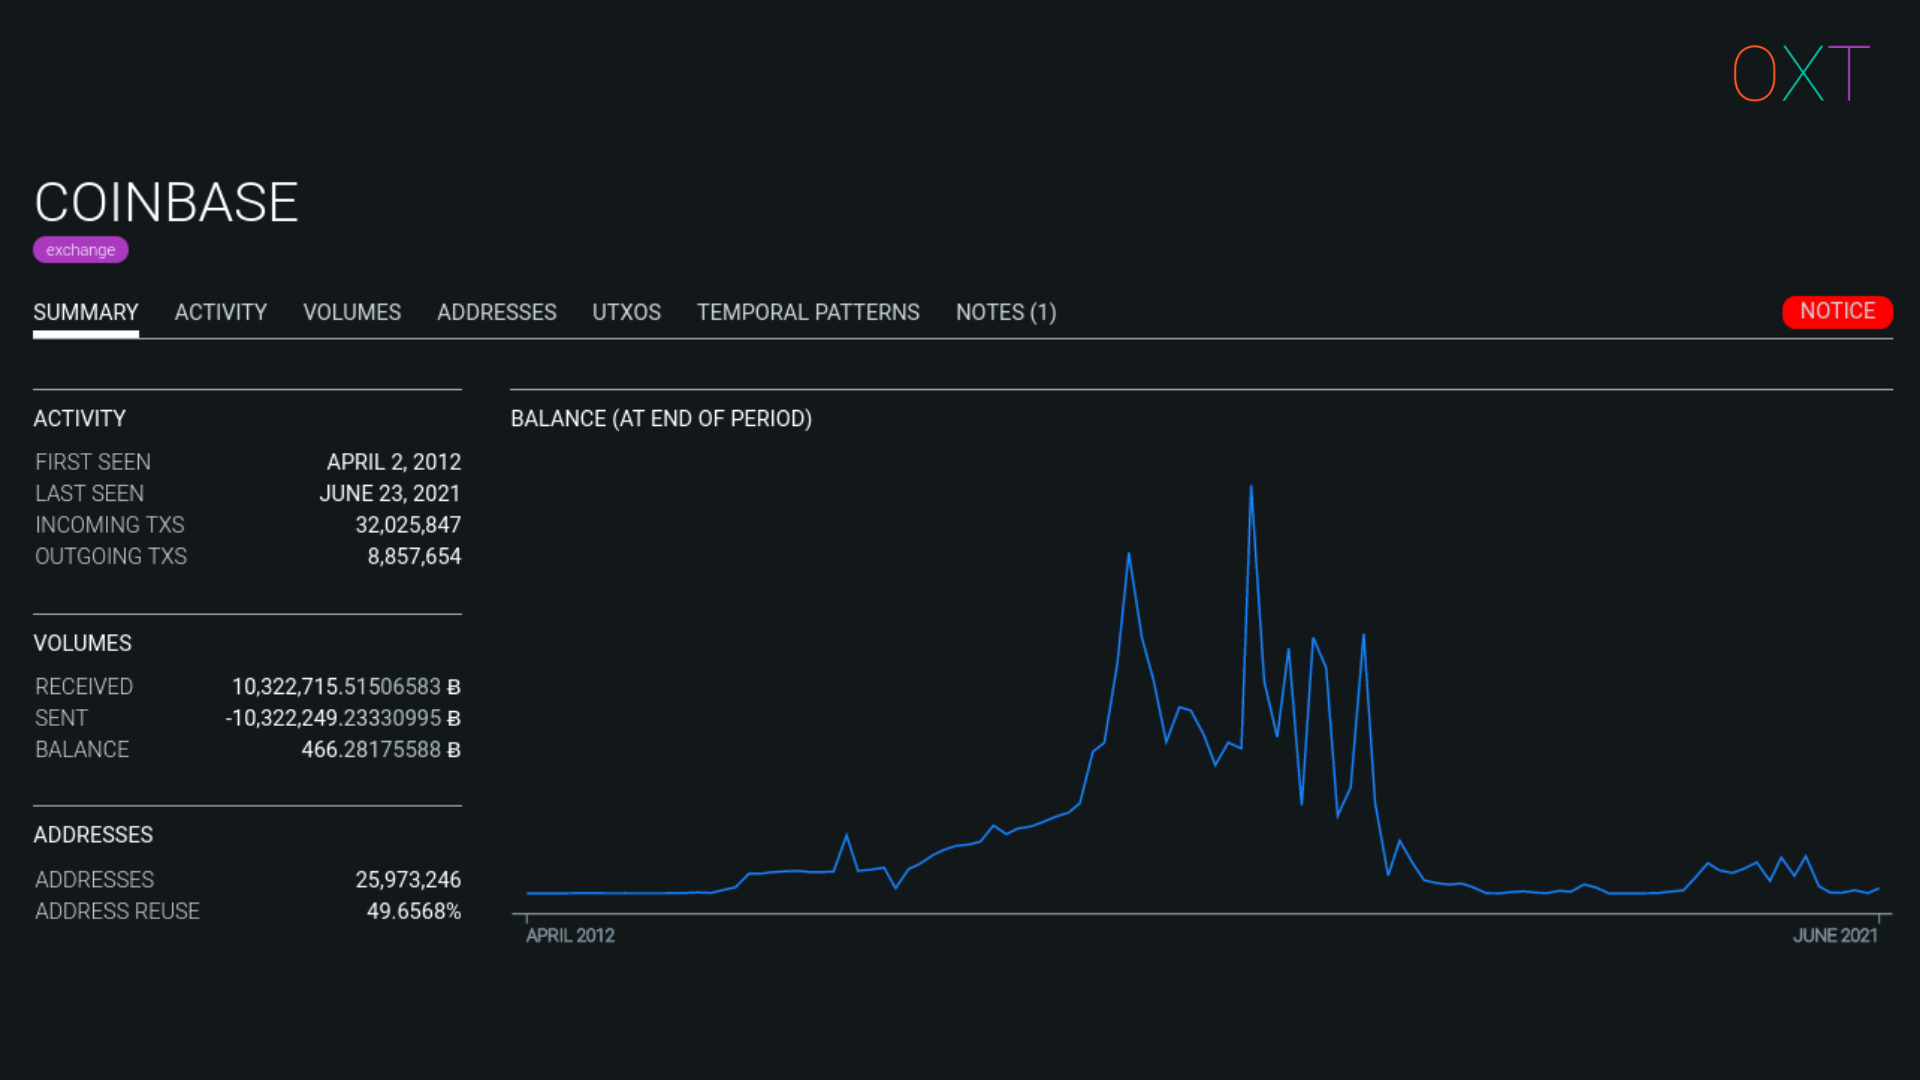
Labelled Cluster Example
Applying External Transaction Data To Change Detection #
Additional information including wallet fingerprinting, output spending timing, and output clustering can be applied to change detection interpretation.
The most damaging to transaction privacy is when a simple spend is made to a wallet cluster that has been identified as a centralised service.
When a simple spend is made to a centralised service, all change detection ambiguity is lost. The output to the centralised service is clearly the payment. The only remaining output is the obvious change output. An example from the future spending of the peel chain example above is shown below.
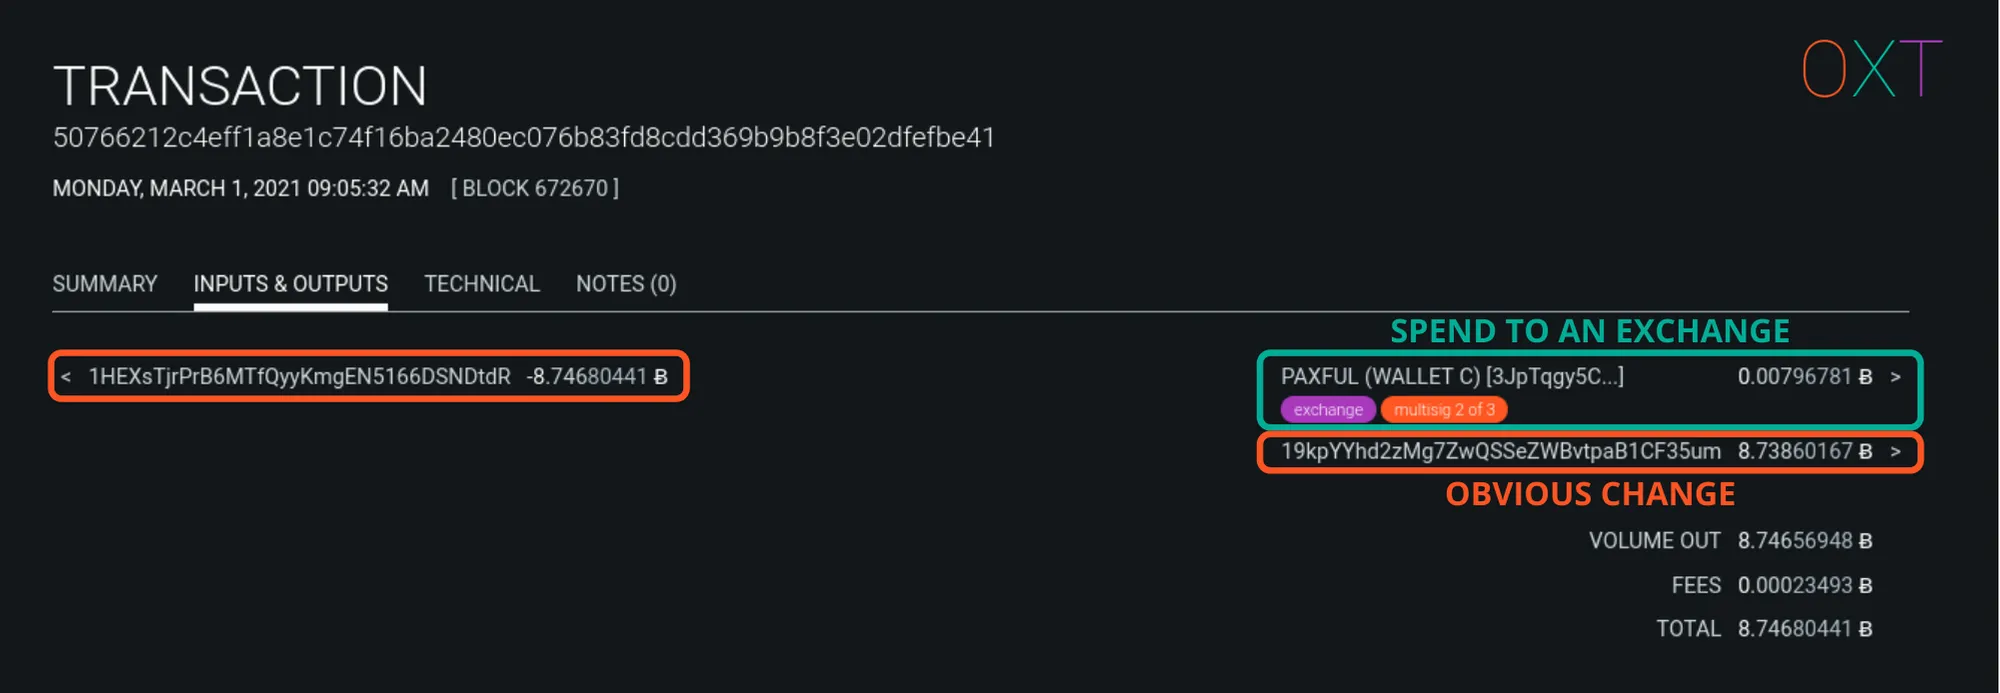
Exchange Payments in Simple Spend Example
The most crucial aspect of the CIOH isn’t necessarily how it is used to target individual user privacy, but how wallet clustering among centralised services negatively and significantly effects the privacy of the the bitcoin network transaction graph.
A significant portion of bitcoin’s economic activity is immediately from or to a centralised service which has a major centralisation effect on the overall bitcoin network transaction graph.
Review #
In Parts 1 and 2 we introduced the fundamentals of chain analysis including change detection, transaction graph analysis, and the common input ownership heuristic.
Change detection consists of a series of heuristics used to determine a likely transaction change output. A transaction graph analysis can quickly and visually illustrate these heuristic interpretations to track the activity of a single user. Additional data including wallet clustering by the common input ownership heuristic can be used to improve confidence in change detection. Attributing a wallet cluster to a user or centralised service activity requires additional off chain data tying a suspect address and spending activity to the noted service.
In the following section we will introduce the concepts used to defeat chain analysis and make user tracking more difficult.
Part 3 covers core concepts of improving bitcoin’s privacy including:
- Randomised wallet fingerprinting for defeating change detection.
- UTXO flows and the fundamental link between inputs and outputs.
- How equal output coinjoins address the issue of deterministic flows.
- Transaction entropy
- How payjoin defeats the common input ownership heuristic
Part 4 discusses:
- Analyses needing a “starting point”
- The privacy implications of sending and receiving payments
- How existing privacy techniques can mitigate many of the issues discussed throughout the guide.
